A 40yrs old man comes in to see you in clinic.
He’s complaining of 2 days ‘sharp’ central chest pain, without radiation. His main complaint is breathlessness, and malaise, following his recent upper respiratory tract infection (URTI) which started 8 days earlier.
On taking further history you discover his pain worse on inspiration, but also on chest wall pressure. At a glance, he looks a little unwell, and has slightly clammy skin. He’s has no significant past medical history, so you guess he really doesn’t feel very well.
What are your thought?
Which other questions would you like to ask?
Questions people asked answered below:
He’s a slim, muscular, non-smoker, on no medication.
His father had an MI aged 68yrs.
No other family history of IHD or vascular disease.
He’s never had any bloods taken, so his cholesterol is unknown.
He’s not previously reported/noted any exertional chest discomfort.
He has had a slight irritant, dry cough since his URTI, but no sputum and haemoptysis, and no history of recent travel.
On examination he’s normotensive, and CVS examination is normal with normal heart sounds and no added sounds. He has a low grade pyrexia and mild tachycardia, in keeping with his reported URTI.
His peripheral O2 sats are 99%. Indeed he has costal tenderness over the anterior chest wall.
He admits he’s worried about his heart.
His history and clinical appearance doesn’t seem suggestive of acute coronary syndrome requiring a 999 admission, so you agree with him to get an ECG, there and then.
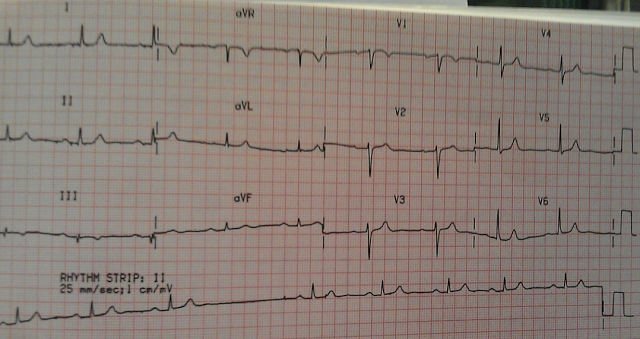
Here it is.
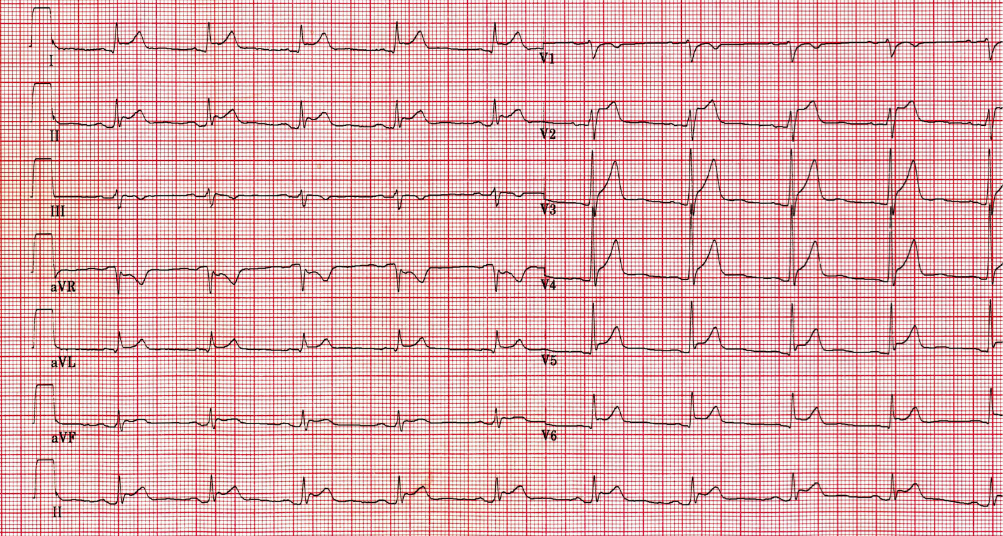
Quick check –
- Can you see P waves? (if unclear in one leads, just check the others – they’re either there or not). If present, quick check – is their morphology normal and consistent? Same for their relationship with the QRS?
- What about the ST segments? How would you describe them? (Take it lead by lead if necessary)
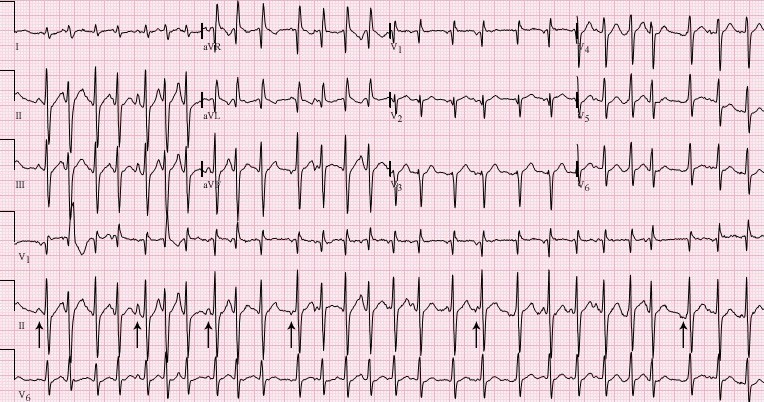
Yes. It appears to be regular doesn’t it, and despite being slightly tachycardic when you examined him, his rate has settled down to around 60bpm.
P waves can clearly be seen and their morphology looks pretty normal and consistent. There is a strange scooping seen after some of them – most notably in the inferior leads. Take a look at lead II, III and aVF – see the slight depression of the baseline between the P and the QRS waves. In contrast – this same PR segment looks to be elevated in avR.
So now to the ST segments. There is widespread (non-localised) ST elevation in all but a couple of leads (V1, III and aVR I think are spared?)
The elevation seen might be described as scooped, or saddle-backed.
So where are you at with your diagnosis?
Are there any other tests you’d like to arrange in Primary care?
Or do you think he needs admitting?
PERICARDITIS
Pericarditis is a cause of ST elevation which often throws us. As it is an inflammation of the pericardium it can lead to ST elevation in almost all leads. This is an important distinguishing feature from myocardial infarction, which has ST elevation localised to the region of infarct. MI also presents more acutely.
If faced with uncertainty, in patients who are not unwell enough to warrant admission, and in whom the chest pain history does not suggest an acute coronary syndrome, then the most helpful test to support the ECG, is a serum CRP (CRP is rarely normal in pericarditis).
Patients with pericarditis are often younger, with a lingering history of onset of symptoms, and frequently present to GP. (Some are inevitably admitted via the paramedic 999 service, having presented with chest pains and an abnormal ECG).
Key Points:
- ST segment elevation is widespread across multiple leads (not localised as in STEMIs) and there is no reciprocal ST segment depression
- Scooped or saddle-shaped ST segments, Often notched.
- Associated PR segment depression – that is depression between the end of the P wave and the start of the QRS. (usually elevated in aVR).
Symptoms:
The chest pain is often associated with viral prodrome – such as a bad cold with aching joints. (Hence inflammatory markers are usually raised)
Longer-lasting symptoms than acute MI.
Pain can be eased sitting forward, and may be worse when laying back.
Examination/Ix
Sometimes associated pericardial friction rub is noted on auscultation (“footsteps in the snow”).
CRP is usually significantly raised (normal CRP pretty much excludes pericarditis)
ECHO may reveal small pericardial Effusion.
Thank you to all who joined in.


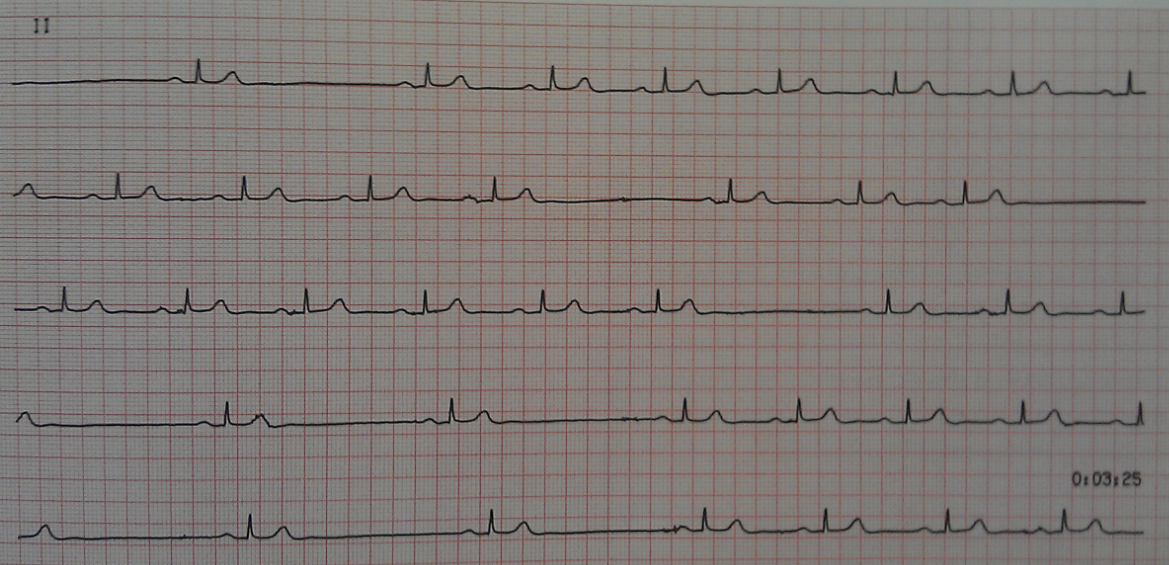 What do you think of the pauses now?