


A 22yrs man, previously fit and well, comes to see you holding an ECG.
He explains he is a medical student. He, and few fellow students, were practicing doing ECG’s on each other. He became worried when he discovered the ‘machine analysis’ on his own ECG mentioned a variety of abnormal features.
He denies any symptoms of chest pain/tightness, or palpitations. He has no significant past history, and has never been in hospital apart from a handful of A&E attendances with rugby injuries.
Apart from being a little overweight, with slightly quiet heart sounds, examination is unremarkable.
Clue: Remember, If you are ever baffled by and ECG, go back to first principals, and work through it systematically.
Start with the axis, then the P waves.
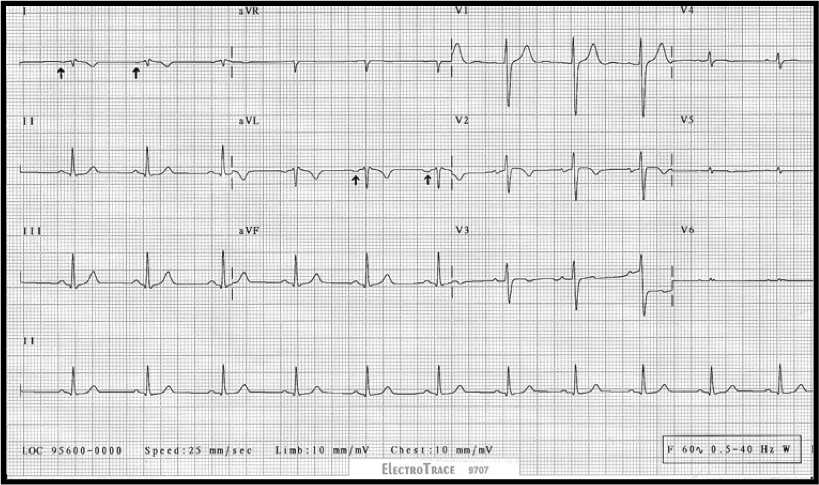
What is the axis on this ECG?
Can you describe the P waves in each lead?
Discussion.
Remember the normal ECG axis?
This ECG unusually shows Right Axis deviation of the P wave (the P wave is Negative in aVL and lead I) and Right axis deviation of the QRS complex (between +90 and +120 degrees).
There is also very low voltage/amplitude in the precordial leads, V4 to V6 .
Whilst this could be down to patient habitus impeding the electrical reading, or a pericardial effusion, if this was so you would expect to see low amplitude in all chest leads.
A normal ECG shows ‘progression of the R wave’ in the precordial leads. In other words the relative size of the R wave to the s wave increases gradually from V1 to V5. (V5 is often remains taller than V6 because of the attenuating affects of the lungs).
Look at Lead aVR. It appears more like we would expect lead aVL to look……
In short, voltage and axis deflections are not as we would expect.
This ECG shows dextrocardia.
Classical Features of Dextrocardia on ECG:
- Right axis deviation
- aVR often shows Positive QRS complexes (with upright P and T waves) –
admittedly, not clearly demonstrated in the above example.
- Lead I: inversion of all complexes, (inverted P wave, negative QRS, inverted T wave)
- Absent R-wave progression in the chest leads (dominant S waves throughout), often with smaller amplitude complexes in the left sided chest leads (V4-6)
Note:
A similar ECG picture would be obtained in the limb leads, if the Right and Left limb leads electrodes had been accidentally reversed on placement. If this was the case, the chest leads would still appear normal showing natural progression of the R wave (maximum amplitude in V3-V4).