Lesson 11

Posted Posted in July

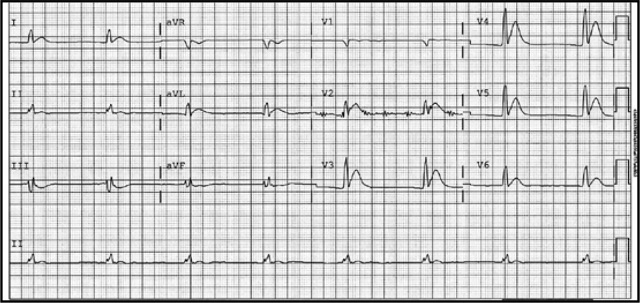
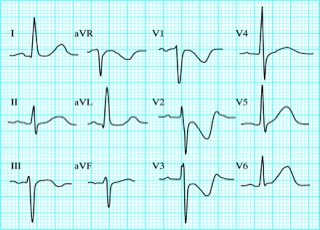
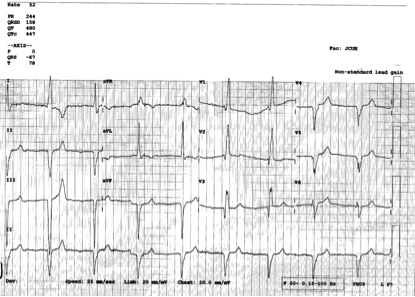
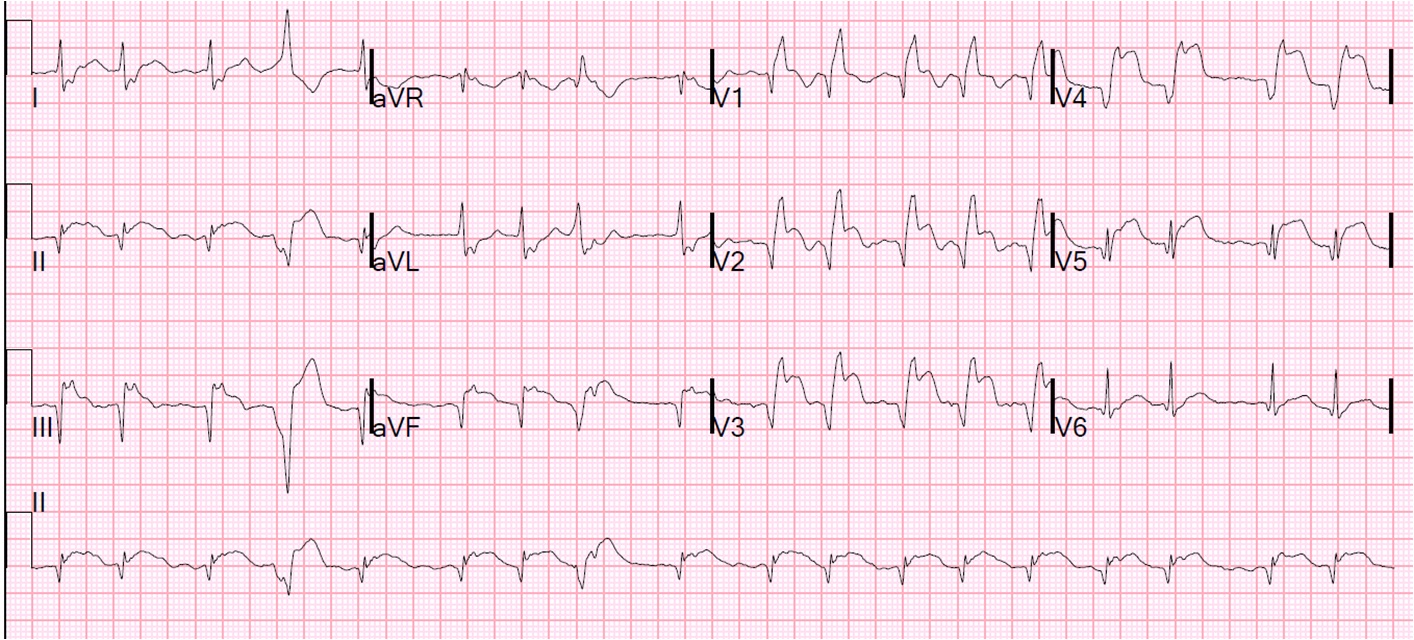
A man in his 60’s presented after 4 days of chest pain, with some increase of pain on the day of presentation.  Exact pain history was difficult to ascertain.  There was some SOB.  He had walked into the A&E (did not use the ambulance).  He was in no distress and vital signs were normal.  Here is his ECG:


First ECG 4 days after onset of pain

What is your interpretation?  Obviously there is MI.  How acute is it?

Description
There is atrial fibrillation at a rate of 95.  There is Right Bundle Branch Block with a QR particularly noted in V1-V3 (no rSR’, because there is an initial Q-wave; this is diagnostic of infarction in the anterior wall and septum).  The Q-waves extend to V5 and are very wide (80 ms in V2).  There are also inferior Q-waves which can mimic a left anterior fascicular block, as they result in left axis deviation.  There is rather massive ST elevation, and this is not only anterior but inferior (see analysis below).

First ECG 4 days after onset of pain-arrows

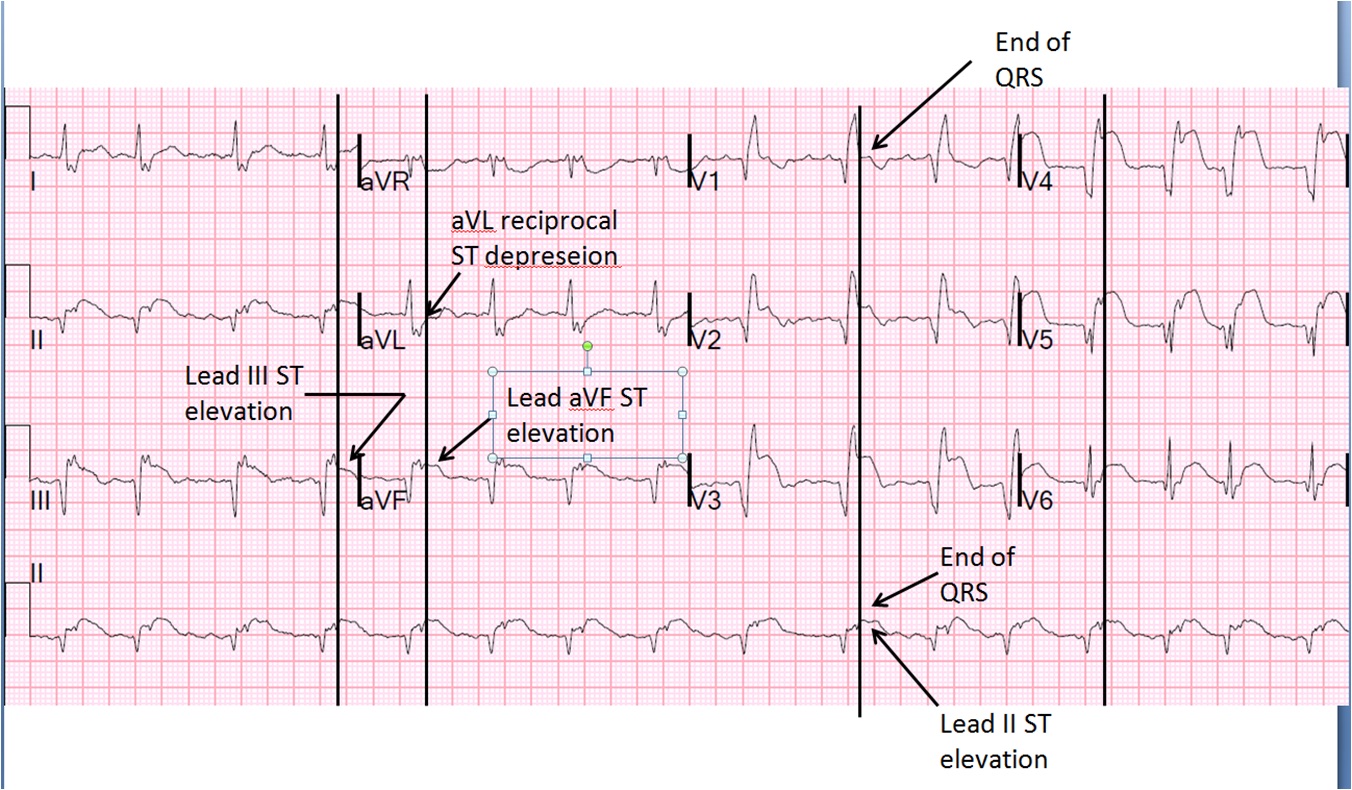
The end of the QRS is best seen in lead V1 (and results in a QRS duration of 176 ms).  If one draws a line down to lead II across the bottom, one can find the end of the QRS in lead II.  From there, one can find the end of the QRS in all leads.  This analysis shows that there is ST elevation after the end of the QRS in lead II, III, and aVF, and reciprocal ST depression in aVL.  Thus, this is BOTH an anterior and inferior STEMI in the setting of RBBB.

How old is this antero-inferior STEMI? 

Could it be acute (vs. subacute or days old)?  Although the patient has had pain for 4 days, could the artery have fully occluded only within hours?  Very unlikely.  Although acute anterior STEMI frequently has narrow QR-waves within one hour of onset (1. Raitt et al.), such Q-waves are associated with larger MI and worse outcomes (2. Armstrong et al.), the presence of such well developed, wide, anterior Q-wave suggests completed transmural STEMI.

So this patient likely has a several day old infarction, with persistent ST elevation and persistently upright T-waves.

The wide Q-waves suggest “transmural” MI (completed MI with infarction of the entire thickness of the ventricle).  This was common in the days before reperfusion of STEMI, but still happens in patients who present late and therefore do not get timely reperfusion therapy.  When there is MI extending all the way to the epicardium (transmural), that infarcted epicardium is often inflamed (postinfarction regional pericarditis, or PIRP).

What complication is the patient with post-infarction regional pericarditis at risk for?

The patient was taken to the cath lab emergently and a 100% mid LAD occlusion was opened but opening resulted in no flow.  The initial troponin I was 23.7 ng/ml and was falling, confirming infarction days ago.

Case Continued

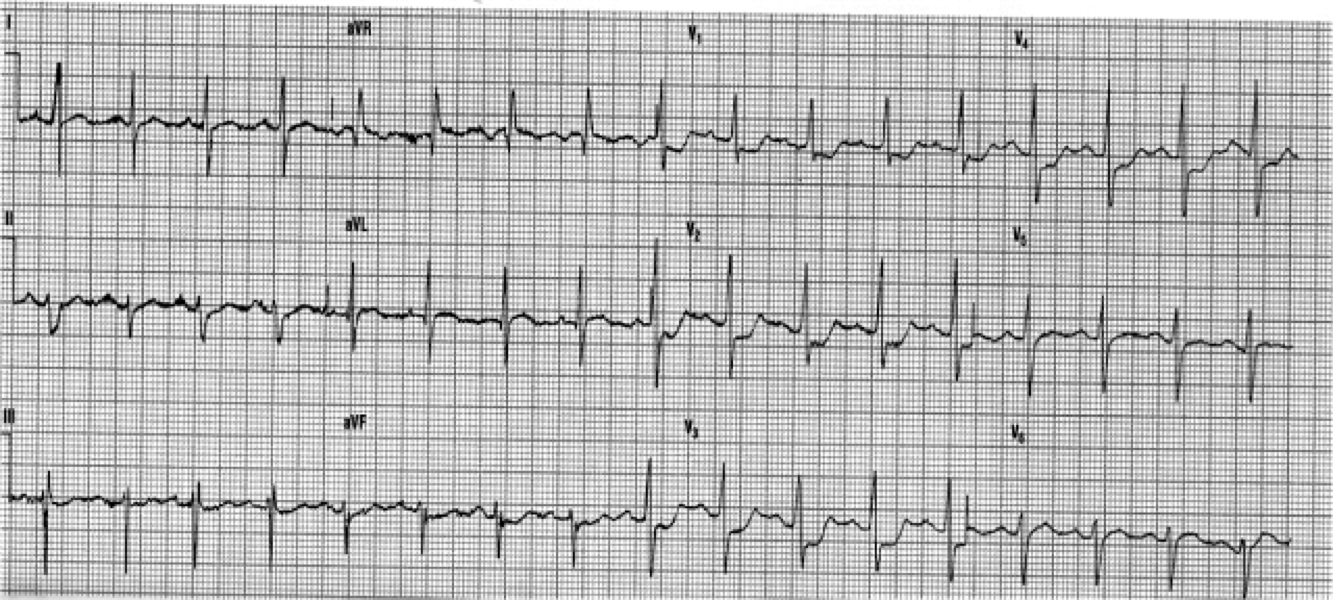
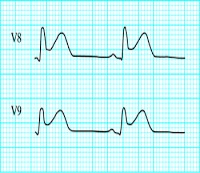
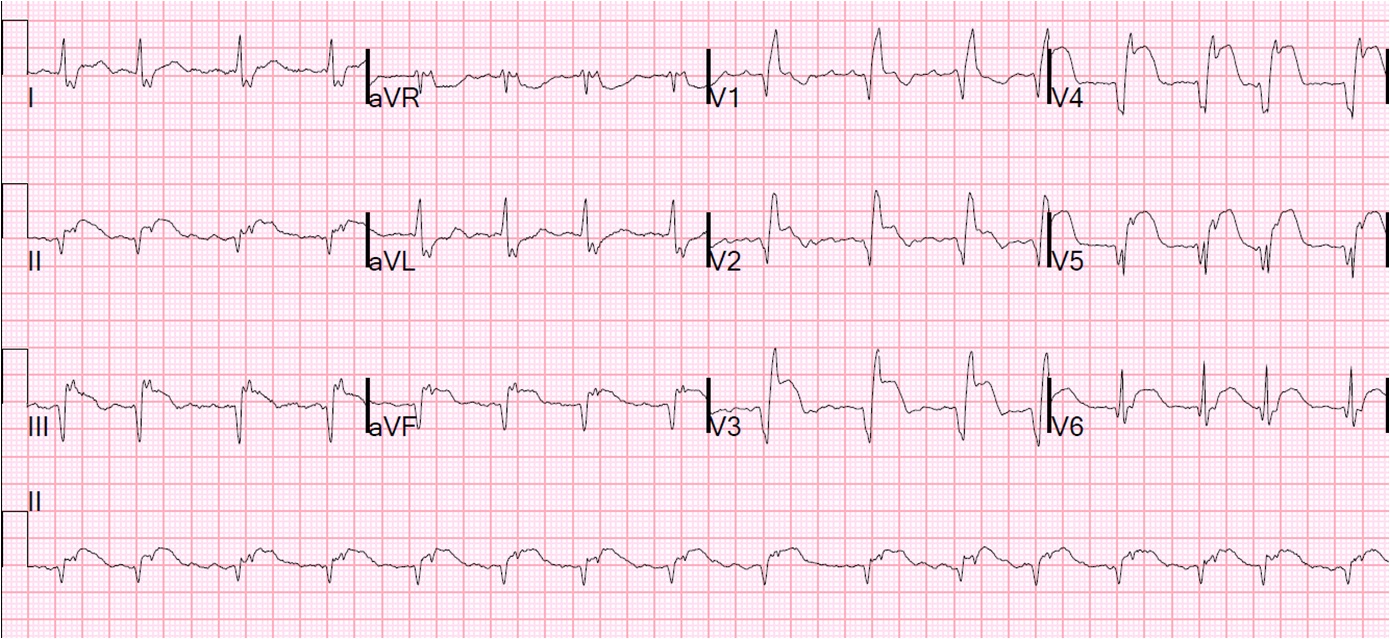
2 days later the patient became increasingly tachycardic, hypotensive, clammy (in cardiogenic shock) and had a new murmur.  This was the 12-lead ECG.

2 days later more STE upright T

Not much change, except a slightly faster ventricular response at 110bpm.  No resolution of ST elevation.  The T-waves are persistently positive.  This remains consistent with PIRP, as was the first ECG.  Notice also how easy it is to diagnose ST elevation in the PVC.

An echocardiogram showed no hemopericardium, but Doppler showed a new small ventricular septal defect with left to right shunting.  This was in addition to a large septal, anterior, and apical wall motion abnormality, and moderately severely decreased LV function.

An intra-aortic balloon pump was placed, and the patient was taken for immediate surgical repair but did not survive.


Discussion

When there is full thickness infarction, there is epicardial inflammation (post-infarction regional pericarditis), and the myocardium is at risk of “rupture.”  The term “rupture” makes it sound like some sort of explosion or massive blowout, but it is usually a small, slow leak that, over time, can cause tamponade and death.  Rupture can be either free wall rupture (causing tamonade) or septal rupture, causing ventricular septal defect with left to right flow and resulting pulmonary edema and shock.  If detected early by ultrasound, the patient can be saved.  Our own Dave Plummer of HCMC reported on survival of 2 of 6 patients with STEMI who had free wall myocardial rupture diagnosed by presence of hemopericardium on bedside ultrasound in the ED.(3)

Oliva et al. (4) strongly associated myocardial rupture with postinfarction regional pericarditis (PIRP), and associated PIRP with persistent upright T-waves.  He found 2 ECG patterns of atypical T-wave development in PIRP:
1) persistently positive (upright) T-waves 48 hours after AMI onset. 
2) premature, gradual reversal of inverted T waves to positive (upright) deflections by 48 to 72 hours after MI onset in the presence of well formed Q-waves.

Lessons:

1. Well formed Q-waves with persistent ST elevation, especially in a patient with prolonged pain, should alert to transmural MI with possible post-infarction pericarditis. One should be on the alert for myocardial rupture.
2. In the case of septal MI, as here, be on the alert for development of a ventricular septal defect.
3. Bedside echo may detect these in a timely way.
4. Additionally, these patients have a high incidence of LV aneurysm with mural thrombus.
5. Although rupture has a high mortality, it is not uniformly fatal


References

1.  Raitt MH, Maynard C, Wagner GS, Cerqueira MD, Selvester RH, Weaver WD. Appearance of abnormal Q waves early in the course of acute myocardial infarction: implications for efficacy of thrombolytic therapy. J Am Coll Cardiol 1995;25(5):1084-8.

2.  Armstrong PW et al.   Baseline Q-wave surpasses time from symptom onset as a prognostic marker in ST-segment elevation myocardial infarction patients treated with primary percutaneous coronary intervention.  J Am Coll Cardiol 53(17):1503-9. Apr 28, 2009.

3. Plummer D.  Dick C. Ruiz E. Clinton J. Brunette D. Emergency department two-dimensional echocardiography in the diagnosis of nontraumatic cardiac rupture.  Ann Emerg Med 1994; 23(6):1333-42.
4. Oliva PB, Hammill SC, Edwards WD. Electrocardiographic diagnosis of postinfarction regional pericarditis: ancillary observations regarding the effect of reperfusion on the rapidity and amplitude of T wave inversion after acute myocardial infarction. Circulation 1993;88(3):896-904.


5. Oliva PB.  Hammill SC.  Edwards WD.  Cardiac rupture: a clinically predictable complication of acute myocardial infarction: report of 70 cases with clinicopathologic correlations.  J Am Coll Cardiol 1993;22(3):720-6


Lesson 10

Posted Posted in July

You are called urgently out of the ECG room. The receptionists have taken an elderly lady straight into a side room, when she was brought in to the hospital by her daughter.

You get as much history as possible from the daughter.

This is an 80 yr old lady who is new the clinic, and you have never met her before. The daughter explains she has become increasingly worried about her mother’s in recent months and has brought her to live nearer.

In the last few weeks she seems to have been getting generally weaker, and has been complaining of headaches and nausea. Her daughter has felt she was more low in mood, and more confused than usual. She was planning to book her an appointment to see you soon, but had been putting her decline down to her recent move, and was waiting to see if she picked up first.

On visiting her this morning, she found her quite ‘out-of-sorts’ and almost ‘vacant’ at times.

On examination she looks quite unwell. A thin, frail lady, who appears to be confused and has started vomiting.

She denies any chest pain.

You make a quick assessment and call the on call cardiac registrar.

Meanwhile cardiovascular and abdominal examination are unremarkable other than a bradycardia. Her BP is 100/60. She’s had no recent blood tests.

Her daughter tells you she has taken Atenolol ‘for many years’ for blood pressure.  Other than that only some weekly ‘bone strengthening’ tablets and calcium/VitD supplements.

You do a 12 lead ECG:

ATC5


What do you notice?

Q1. Can you see P waves? Is it regular?  What is the rate?

What is the likely explanation?

Q2. Comment on the QRS complexes, ST segments and QT interval. (Hint: just describe what    you see)


Discussion.


Q1. The heart rate is between 42-50 bpm (calculated crudely, by counting squares).  This is of course assuming standard paper speed of 25mm/sec (not stated).


There are between 6 and 7 large squares between each QRS complex. So the rate is between 300÷6 and 300÷7


Using a rate-ruler, it’s 42 bpm 😉


So it’s a bradycardia.


I can’t make out any P waves, but the rhythm is regular.

This is most likley a junctional escape rhythm.

The Atenolol won’t be helping!


Q2.  Firstly, the QRS complexes are a little wide (more than 1.5 small squares, but not > 3 small squares – as needed to define a bundle branch block). This suggests an intraventricular conduction defect. On it’s own, this can often be seen on ECGs, and may be of no signicicance.


More interesting, are the ST segments and QT interval.


This ECG has a very short QT interval, with hardly any ST segment. This is the classic ECG picture of Hypercalcaemia.


Normal QT interval range:  0.36 -0.44 seconds (9-11 small squares)

On this ECG:


Corrected QT (QTC) = Bazett’s Formula = QT Interval / √ (RR interval).


Measured QT interval (ms) = 400

HR = 42

RR Interval (60 ÷ HR)       = 1.4

√ RR                              = 1.2


QTC   334.7ms (0.33 sec)


HYPERCACAEMIA

Mild hypercalcaemia may have no symptoms or signs.

Symptoms of hypercalcaemia are more common at high serum calcium levels (12.0 mg/dL or 3 mmol/l). They include:


  • Nausea & vomiting
  • Alterations of mental status / lethargy / depression / headache/confusion
  • Abdominal or flank pain
  • Weakness and vague muscle/joint aches
  • Polyuria, polydipsia, nocturia

Causes include

  • Malignancy (via caused by increased osteoclastic activity within the bone)
  • Primary hyperparathyroidism.
  • Vit D toxicity (rare but recognised – see below)


Severe hypercalcaemia (above 15–16 mg/dL or 3.75–4 mmol/l) is considered a medical emergency, and cardiac arrest can result.


Electrolyte changes and the ECG can be remembered by recalling this simple sketch:

twave kplus

The T wave generally goes up and down with K+ level

The QT interval generally lengthens & shortens opposite to  Ca2+ levels

Hypercalcaemia produces classical ECG changes of short ST segment, and a short QT interval. Sometimes the T wave is widened.


Hypocalcaemia gives the opposite effect, that is, a long ST segment and long QT interval.


Hyper- and Hypokalaemia – Generally, the amplitude of the T wave is proportional to the serum K+ level.

Is it possible, that this mildly confused lady, has been taking accidental overdoses of her calcium supplements, or even taking over the counter cod-liver oil in addition to her prescribed medication……???

Vitamin D Toxicty causing Hypercalcaemia with ECG changes.

This Pubmed link from July 2013 highlights the rare, but potentially fatal complication of Vitamin D3 (cholecalciferol) toxicity.


Severe hypercalcemia can sometimes mimic an acute Myocardial Infarction on ECG.   This earlier Pubmed article, of 2003, presented a case of Vitamin D intoxication which mimicked acute myocardial infarction.


Hypercalcaemia can also mimic hypothermia, giving an ECG appearance of the Osborne wave.

Food for thought as more and more people become aware of the potential benefits of Vitamin D supplements.


See you next week.

Lesson 9

Posted Posted in July

#Pulsemdx is an educational blog which runs alongside Twitter.
A new ECG “quizz” is launched every Monday evening. 
Any discussions generated with be archived for summary and reflection, on the following interim @Pulsemdx

A 56yrs man who rarely attends, but he woke in the small hours of the night with ‘indigestion’. The pain hasn’t got any worse, but it’s niggled on for several hours now, so his wife booked the appointment and insisted he came down to have an ECG before work.
He’s never really suffered with indigestion before, but has no cardiac history or risk factors.

He looks a little unsettled and restless, but nothing else of note. Apart from a slight tachycardia, his pulse is normal, and BP borderline elevated (he’s visibly a bit anxious).

The ECG shows:

ECGclass


What does the ECG show? (Stick to describing the ST changes only).

The ECG shows 2-3mm of horizontal/downsloping ST depression in leads V1-4

At first glance I would have felt this showed anterior ischaemia.

But, bear in mind, he has ongoing pain, at rest.   This has to be assumed to be Acute Coronary Syndrome until proven otherwise.

In accordance with NICE Guidelines for new onset chest pain, and in order appropriate to the circumstances, offer:

  • Pain relief
  • Aspirin
  • Other Therapeutic interventions
  • Pulse oximetry (supplement O2 only if % SAO2 indicates)
  • Monitor until ambulance arrives (GP) or diagnosis confirmed (Hospital)

On arrival at A&E, serial troponins were taken, and the posterior ECG leads (V7-9) were monitored. 

A subsequent diagnosis of Posterior MI was made.
Posterior Myocardial Infarction

With Acute MI, the presence of persistent ischaemic pain, indicates that still viable areas of ischaemic and injured myocardium are in danger of necrosis.

It is outwith the concept of this forum, to go into management of Acute Coronary Syndrome (ACS) in any detail, but everyone should make themselves familiar with the NICE Guideline “Chest Pain of Recent Onset” (CG95).  

Pages 1-9 of the Quick reference guide linked above, deals with ACS, whereas pages 10 onwards, deal with stable angina.

In STEMI, the ECG leads which are orientated to the area supplied by the affected coronary artery will reveal the ST elevation. And so, the area of infarction can be determined by which leads of the ECG are affected:

Lead

And it follows, that the coronary artery affected in Acute Myocardial Infarction, is determined by the location of the MI :

Site


Of course, reliance on ST elevation to diagnose STEMI, assumes we are viewing the affected myocardium from the front. What if the ST elevation is in the posterior myocardial wall?

If ST depression is present in leads V1-V3, with ongoing chest pain, then recording of the posterior leads (V7,V8,V9) will be invaluable. 

The posterior leads are placed on the posterior chest wall:

Lead place

Of course,the recordings from the 3 posterior leads will therefore be a mirror-image of V1-3 :

ECG00

00ECG

And so, the posterior ST elevation becomes obvious.

Posterior MI is often a bit of an enigma to GP’s and students, and I’m sure we all recall been told to flip the ECG paper upside down, and view form the back. When lacking precious time/ability to monitor the posterior leads, this method can still be invaluable – it’s just remembering to think of it!


Hope that helps a little.
Looking forward to any more gems of education on posterior MI’s (for me) from anyone who’d like to add a comment! 🙂

Thank you.

Lesson 8

Posted Posted in July

All cases are generally aimed at healthcare students and professionals. 

All scenarios are completely fictitious and theoretical, but based on commonly occurring presentations in  practice. 

 
This is an educational site, intended for healthcare professionals and shouldn’t be construed as patient advice. 
 
So. This delightful 84yrs old man has been referred to clinic for an ECG. Amongst other things, he mentions some chest pains. His symptoms are a bit vague and non-specific. He’s been having them for 6yrs. They don’t sound cardiac, but he has a history of IHD.
He’s not a fit man, but on the other hand, he’s not clinically unwell today.


A long with his known IHD and CKD5, he’s also pretty immobile from his osteoarthritis and obesity. He seems a bit breathless today.
You think this could be anything….! He has a lot of potential problems.


You note from his recent annual review blood checks that he has chronic stable anaemia (Hb10.5ish for many yrs) secondary to his CKD. His renal function is stably poor (eGFR is 10-12).

Lets look at the ECG methodically and see if it helps. All ECG’s can be analysed with a few simple rules. If in doubt, just describe what you see.

1

Rate

The rate has already been calculated for you at 52bpm. If not a quick ready reckoner is as follows: 
For regular rhythms: Rate = 300 divided the number of large squares between 2 complexes. 
For irregular rhythms: Rate = The number of complexes in 30 large squares (ie

6 seconds) multiplied by 10 

Rhythm 
Comment – Is this a regular or an irregular rhythm? 
It’s regular. Best seen by studying the QRS complexes in long lead II in this case. 
If there is no rhythm strip on a 12 lead ECG, you may only have 3 complexes to study. If so, regularity can be very difficult/impossible to determine. 

P-waves 
Are there any P waves? Are they obvious – or perhaps hidden in other waves, or non-existent? How do they appear (Morphology? Orientation? Size?) Do they have a consistent appearance? Do they have a consistent relationship with the QRS? 
I can just to say see P waves in the chest leads v1-6 but they are subtle! Because of poor quality baseline, I can’t see them in the limb leads or rhythm strip. (It may be impossible to see on your social media device – may need to zoom in or print a large copy) 
(Cheats tip: If you’re not sure about seeing complexes – get a repeat ECG with the ‘gain’ increased to magnify the complexes. This is the second ECG I took on this man – you may have noticed the comment on the top right of the ECG: “non Standard lead gain”). 
On his standard ECG I couldn’t be sure if he had P-waves or not. If there were no P-waves, then this would be a ventricular escape rhythm ie. No atrial activity seen, and the ventricles have helpfully responded by setting up their own pacemaker focus somewhere within them. 
Of the few P-waves we can see, their shape is uniformly round. They appear to be upright in V1 but possibly inverted in v2-6. Not important for purposes of this lesson. 

The P-waves we can see appear to have a consistent relationship with the following QRS complexes, HOWEVER, this is prolonged… 
The normal PR interval (start of P wave to the first deflection of the QRS complex) should be 3-5 small squares (0.11 to 0.20 seconds). In this case the PR interval is between 8-9 small squares. (>0.32 seconds) 

SO, FOR A STARTER, THIS ECG SHOWS A REGULAR RHYTHM WITH 1ST DEGREE HEART BLOCK. 

QRS Complexes. 
Now we need to study the QRS complexes.
We’ve already decided they are regular.
We can’t really comment on the size, because we now know that the gain has been increased. So there’s no point thinking about LVH on this ECG. 
We can consider their shape. Are they consistent in all leads? What about their orientation?
Is there any axis deviation? 
(If you need help with calculating axis and normal conduction orientation, then refer back to link on previous #ECGclass – or search “ECG Teacher-Axis video” on You Tube!) 
What is their duration?
(A normal QRS complex should be no wider than 1 and half to 2 and half small squares (0.06 – 0.11 seconds). 


In a heart with a healthy conduction system, once the impulse passes through the AV node, it travels through bundle of His, and down the Left and Right Bundle branches. As long as there is no delay in this conduction, this gives rise to a narrow QRS complex (less than 3 small squares). 
If, however, after the impulse reaches the Bundle of His, there is any delay in the conduction, through either the Left or Right bundle branch, then the QRS complex will be widened. 

LBBB usually gives rise to a wider QRS complex than RBBB. In LBBB, the width of the QRS is > 120ms (MORE than 3 small squares) whereas RBBB is often ≤ 3 small squares.

LBBB = Left chest leads (I, V5 and V6) show RSR pattern (remember: WiLLiaM 
RBBB = Right chest leads (V1 and 2) show RSR pattern. (remember MaRRoW) 

If we go back to the ECG in Case 4, we notice that the QRS complexes are slightly broad, with RBBB formation. 

NOW WE KNOW, THAT THIS ECG SHOWS A 1ST DEGREE HEART BLOCK, PLUS, A RBBB. 

But, that’ s not all….

If you have successfully worked out the cardiac axis, you will also see that there is 

Left Axis Deviation here. RBBB alone would not normally alter the cardiac axis. 
Two common causes of LAD are:
1. Left ventricular Hypertrophy 

2. Inferior MI
3. May be normal variant in obese or stocky habitus


A none of these situations apply here, so we know something else must be going on. 


The Left Bundle branch divides into two – the Anterior fascicle, and the Posterior fascicle. If both fascicles are blocked, then it becomes a full LBBB, but if only one fascicle is blocked, this is known as a “Hemiblock” or “Fasicular” block. 

A Left Anterior Hemiblock (Left fasicular block), will always cause a LAD. 
If you ever see RBBB + LAD, on an ECG, then you almost certainly have a LEFT ANTERIOR HEMIBLOCK. 

So this 84yrs man has a FIRST DEGREE HEART BLOCK, RBBB AND LEFT ANTERIOR HEMIBLOCK. 
In fact, he is relying entirely on his small posterior fascicle, of the left bundle branch for ventricular conduction. If that fails him, he’s in trouble. 

Unsurprisingly, an ECHO revealed severely reduced LV systolic function. He needs a full cardiology assessment and consideration for pacing.